 AI with Breakfast
Building with AI Before Breakfast: F1 Live Dashboard
 Lee
LeeBuilt in this post
F1 Live Dashboard
Web
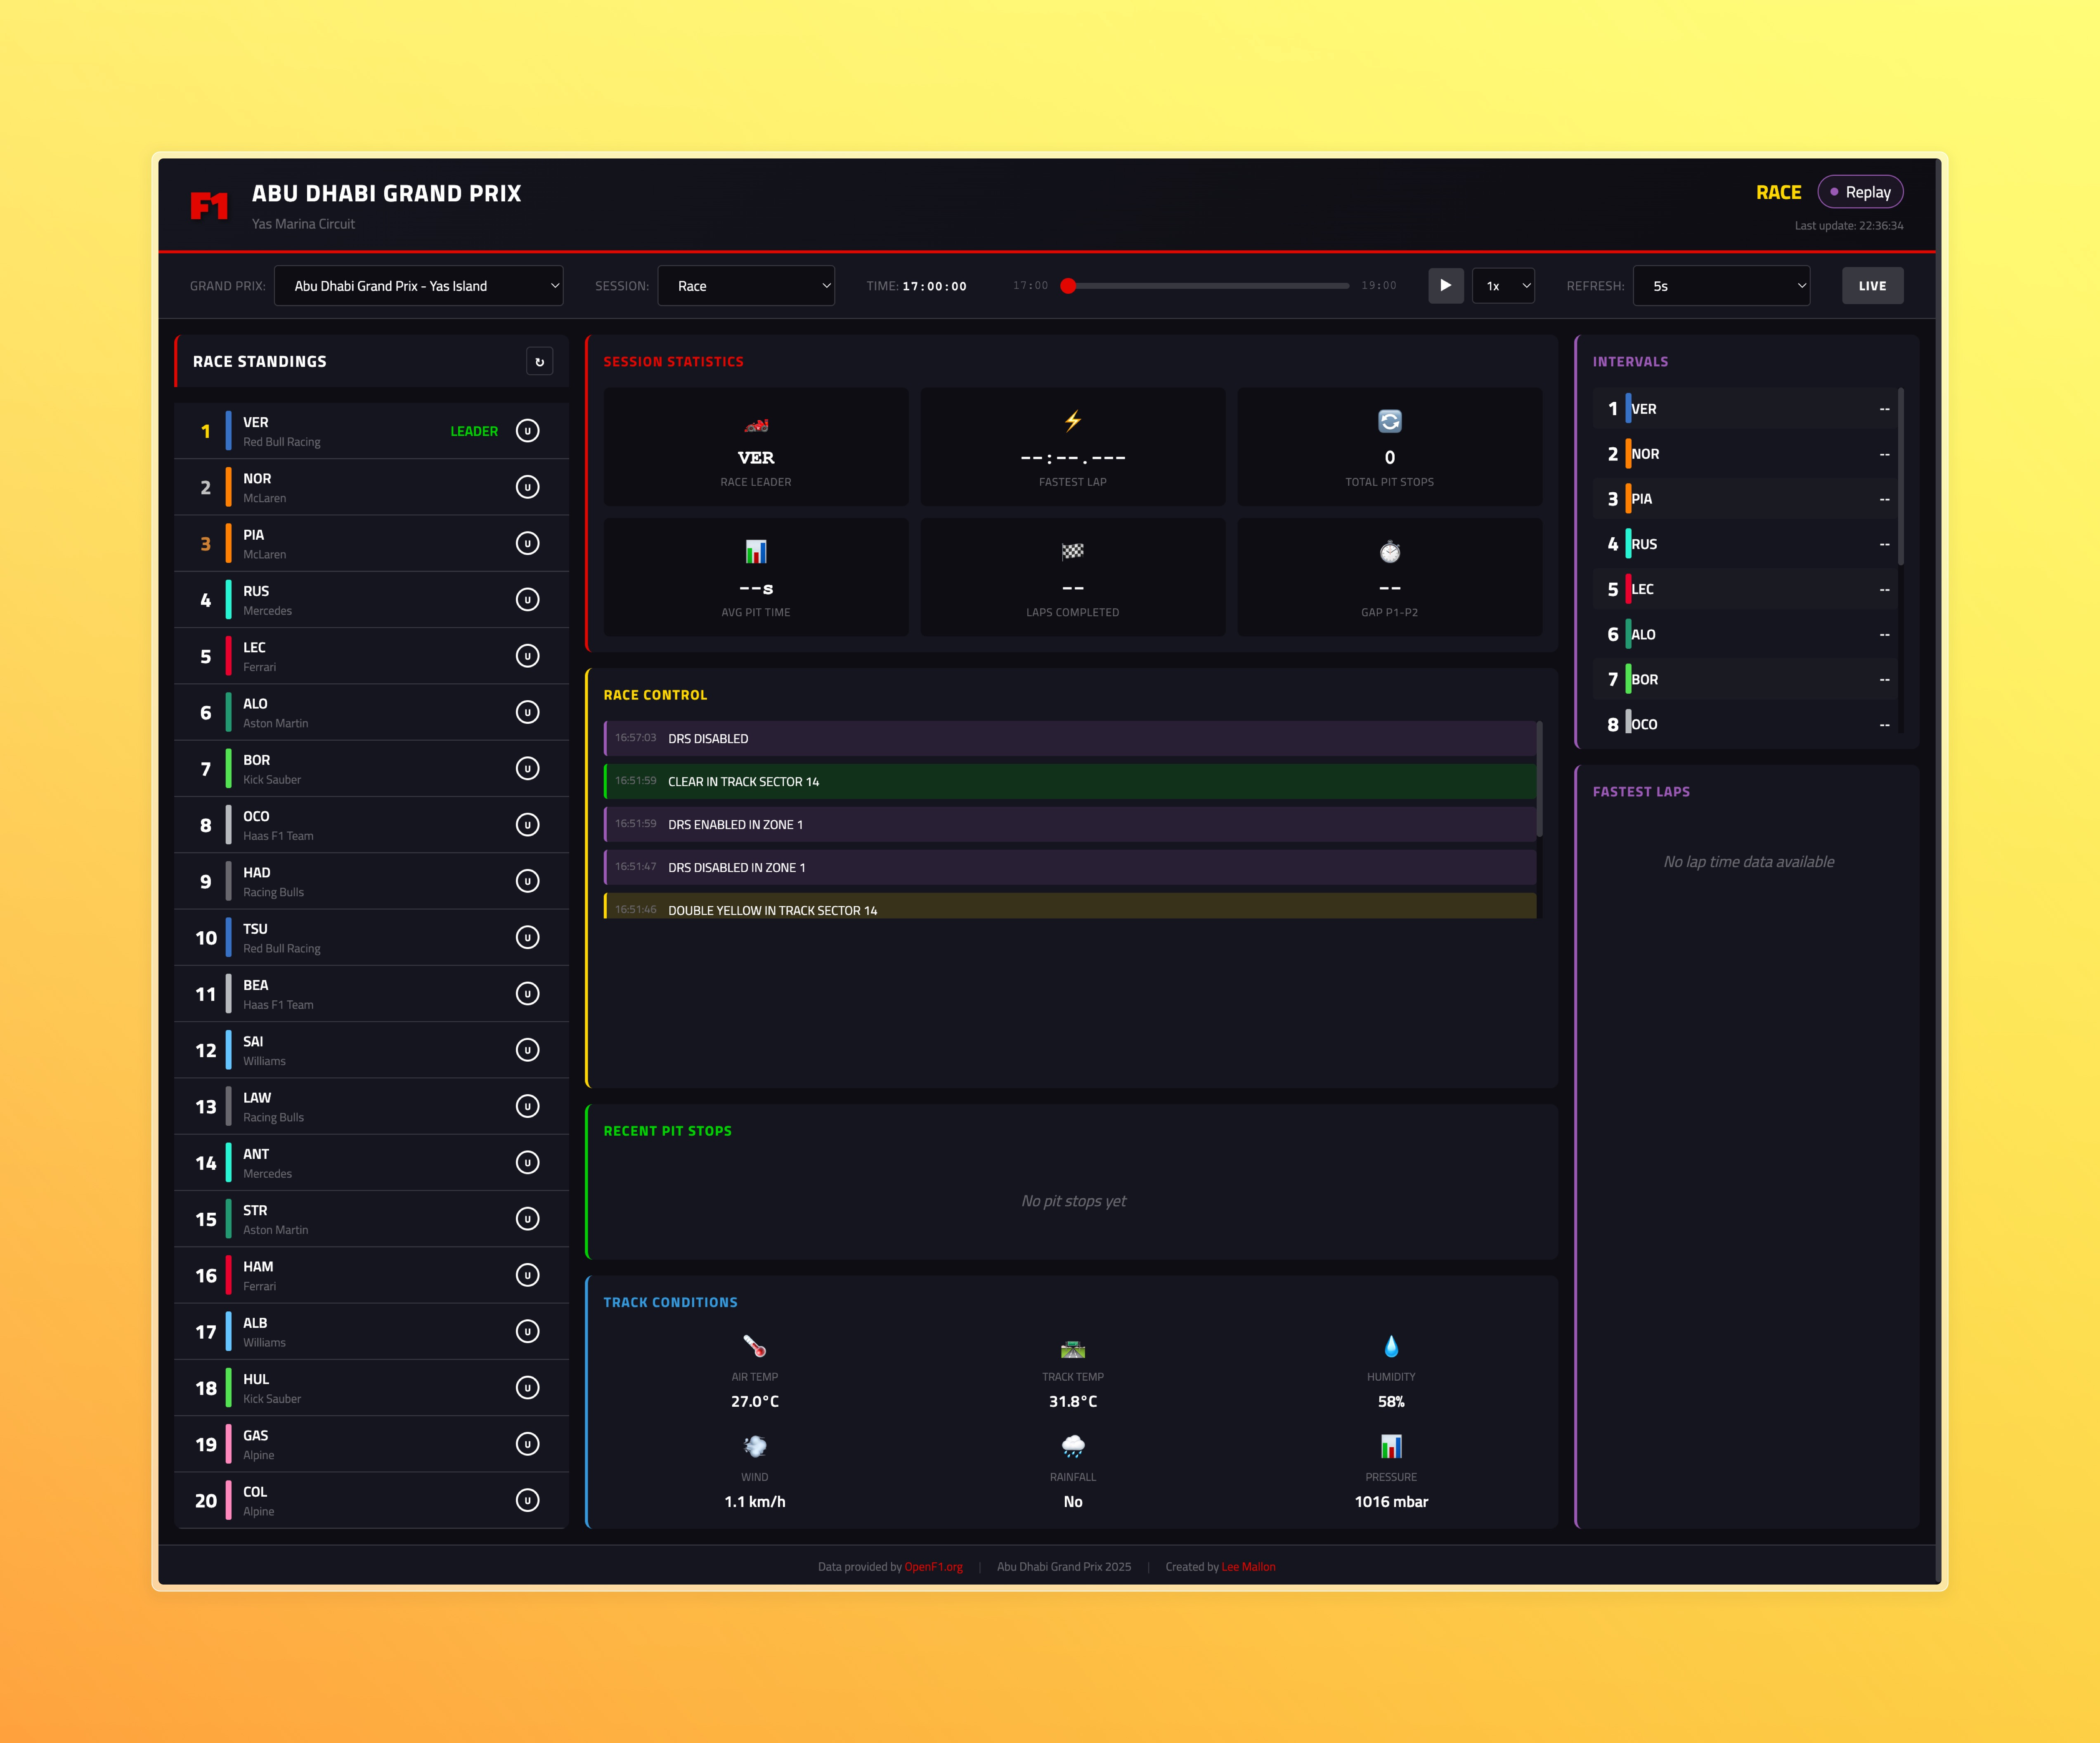
Instead of lingering over which cereal is too bad for me, I’ve been using that same hour each week as a little building sprint with AI. The rules are simple: pick a tiny idea, see how far I can get in roughly “one breakfast”, and ship something useful (or at least fun).
This time, the setting wasn’t in the kitchen but the back of a taxi on the way to the Abu Dhabi Grand Prix.

The problem: great seats, terrible visibility
This year I was lucky enough to get tickets for a couple of F1 races. The seats were brilliant, south grandstand on the hairpin (saw Lewis crash out) but there was one very practical issue:
I couldn’t properly see the big screen.
That meant all the useful context you normally get on TV – live positions, gaps, tyre strategy, sector times – was essentially impossible to follow from where we were sitting. You can open the F1 app or the BBC app, of course, but you’re at the mercy of whatever view they offer and lots of tapping around.
I wanted something different:
A simple, glanceable dashboard on my phone
Built around the exact info I care about while watching track-side
Using open data, not anything proprietary
So, on day two, I did the obvious thing: I asked an AI.
Step one: finding open F1 data
My first prompt, in ChatGPT, was essentially:
“Is there any way to get open source F1 data with timing and telemetry?”
It came back with a few options, and one of them was OpenF1 – a library that wraps official timing data and makes it easier to use.
OpenF1 looked:
Open and well-documented
Widely used in the F1 data community
Reliable enough for what I had in mind
That ticked the “open source” box and gave me a proper data backbone to build on.
Step two: describing the dashboard
Once I had a data source, I switched over to Claude and started outlining what I wanted. I was literally in a taxi on the way to the circuit, so I spoke most of this via voice:
“I’m at the Abu Dhabi F1.
I’d like a mobile-friendly dashboard that shows live driver positions, driver names, car numbers, team names, fastest lap, and some basic track stats.
Use OpenF1 as the data source.”
Claude generated the first version of a dashboard:
A table of drivers and positions
Team names, numbers and gap information
Fastest lap details
A section for circuit information
After a couple of iterations – “make it cleaner”, “optimise this for mobile”, “reduce clutter” – it started to look like something I could actually use while sat in the grandstand.

Step three: exploring the telemetry
Once the basics were working, curiosity took over.
I asked Claude to dig deeper into the OpenF1 API:
“What interesting telemetry can we pull from this that would be fun on a live dashboard?”
It turns out there’s quite a lot available:
Whether the car is braking or accelerating
Throttle position
Gear selection
Various other telemetry channels per lap
You can also access:
Transcripts of team radio calls (via text)
Official race control messages (safety car, yellow flags, etc.)

The positional data wasn’t perfectly clear in the way it was exposed, but there was more than enough to make the experience a lot richer than a simple timing screen.
I didn’t want to turn it into an F1 engineering workstation, so I focused on what would make sense while actually watching live: a combination of positions, timing, flags and “is something interesting happening with this car right now?”
Step four: supporting every race, not just Abu Dhabi
While waiting for the next race session, I realised there was no reason to limit this to just one Grand Prix.
I asked Claude:
“Add a dropdown so I can choose any race from this season and load the data for that session.”

It generated a selector that listed all the races, and I extended the idea:
Race dropdown – pick any Grand Prix from the season
Session selection – practice, qualifying, race, etc.
Search – quickly jump to a specific race without scrolling
Suddenly this wasn’t just an Abu Dhabi race-day hack; it was a season-long F1 companion.
Step five: live mode, auto-refresh and playback
The next thing I wanted was to have the dashboard behave more like a live timing screen.
So I asked for:
“An auto-refresh option that updates the data every few seconds, and a way to control the refresh rate.”
We added:
A live refresh toggle
A dropdown for refresh interval (every 3 seconds, 10 seconds, etc.)
While testing, I noticed something amusing: F1 TV’s stream is about six seconds behind the data I was pulling. So the dashboard ends up slightly ahead of the broadcast.
Once live mode was working, I wanted the opposite:
“Add a playback mode so I can replay a race at different speeds – for example, compress a full race into about two minutes.”
Playback mode lets you:
Pick a race
Scrub (or auto-play) through the laps
Watch positions and times update as if the race is happening in fast-forward
It’s a surprisingly fun way to relive a Grand Prix without committing to a full two-hour rewatch.
Step six: making it actually usable on a phone
Given that the whole point was to use this at the circuit, mobile optimisation mattered.
I asked Claude to:
Prioritise a single-column layout for smaller screens
Keep fonts readable in bright daylight
Make the most important info (positions, flags, gaps) visible above the fold
After a few tweaks – “reduce the padding”, “simplify the header”, “make this table scroll horizontally on small screens” – it felt good enough to use from the grandstand without constant pinching and zooming.
By the time the taxi pulled up at the circuit – somewhere between 15 and 20 minutes – I had a working, mobile-friendly companion app for the race.
I deployed it to https://f1.leemallon.com, It currently works across the full season for this year, and in theory it should continue to work next season too. We’ll find out properly when racing starts again in February/March.
Built in this post
F1 Live Dashboard
Web